Just as we have just gotten used to the HSCIC website… it changes.
My next few blogs will focus on some of the interesting Primary Care data included on the new website – basically, a busy practice manager’s guide to the most interesting data trends on the site. This week, how data shows a change in the amount of complaints within Primary Care…
Background to HSCIC
In July 2016, the Health and Social Care Information Centre (HSCIC) changed its name to NHS Digital, building on the role it plays in directly supporting the NHS and social care services. HSCIC, now NHS Digital, is the national provider of information, data and IT systems for commissioners, analysts and clinicians in health and social care.
Its work includes:
- Publishing more than 260 statistical publications per year.
- Providing a range of specialist data services.
- Managing informatics projects and programmes, and developing and assuring national systems against appropriate contractual, clinical safety and information standards.
Have you ever wondered ‘Where does all this data from research and information collection GO to? How is it used? Why do people need to collect so much data from us?’ Well, the new website goes some way to sharing the results of all the surveys and data collection that we’re asked to do these days in General Practice. Take a look; it has improved so much since July:
http://content.digital.nhs.uk/
It is so easy to use – but do we have the time to explore it?
Well, that’s what we’re here for! As well as all of the front-page publications, there are other elements that can be selected from the drop-down topic menu in the middle of the page.
Try selecting:
- Primary Care
You can then select a sub topic from:
- Statistical publications
- Data collections and data sets
- Systems
- Services, tools, and other support information
From the above options, I chose:
Data collections and data sets
http://content.digital.nhs.uk/datacollections/ko41b
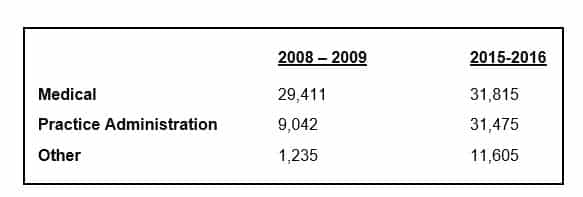
We all know what ko41B (annual complaints submissions) is, but taking a look at year-on-year comparisons proves interesting:
What is interesting is that, from 2009 – 2016, the clinical complaints have relatively stayed very similar, with only an 8% increase, but the practice administration complaints have increased by 71%. ‘Other’ complaints have increased by 89%.
This can help us to analyse our own individual practices – it may be an idea to analyse the complaints within our own practices and make year-on-year comparisons, compared to National results.


